#6 - Evaluating Team Effectiveness with a Data-first Approach | Bhavini Soneji, Executive Leader (ex-Cruise, Headspace, Microsoft)
Eating pie (charts) for breakfast.
👋 Hey friends, welcome to a newer article in our series of in-depth guides, made for you by engineering leaders we met over the past years while building Plato. If you’re new here, you know what to do:
For this article, Bhavini Soneji, engineering executive now executive consultant, is sharing the lessons about team effectiveness that she’s learned at companies like Microsoft, Heal, Headspace and Cruise.
Bhavini Soneji, 25 years of Tech Leadership
"A coach is someone that sees beyond your limits and guides you to greatness"
The above quote isn’t from Bhavini, but rather from Michael Jordan. Yet you’ll see it front and center on her website - and for good reason: this is the philosophy she applied in her tech career.
We met Bhavini at a Plato meetup in Los Angeles a few years ago, while she was a VP of Engineering at Headspace. We immediately clicked with her vision of leadership: empowering people to discover their strengths and amplify their impact.
As an established executive with over 25 years in the software industry, she’s recognized for architecting scalable software solutions that reached billions of users. Her journey includes roles such as VP of Engineering at Cruise and Headspace, CTO at Heal, and strategic positions at Microsoft.
Her experience has shaped her approach to driving growth, for both organizations and the people within them, either as a Fractional CTO, an Executive Advisor, or as an Executive Coach. Bhavini combines her passion for elevating humans with a strong belief in data to make informed decisions.
At Elevate 2023, we were fortunate to have Bhavini on stage, who shared her framework to improve team effectiveness, balancing human-centered design and data-driven decisions 👇. This blog post digs even deeper and aims to illustrate each piece of advice with real examples from Microsoft, Headspace, and Cruise. We hope you like it!
You can follow Bhavini on Linkedin and on her website. Let’s go!
Evaluating Team Effectiveness with a Data-first Approach
Throughout my 25-year career, I’ve led team transformations while driving business and customer outcomes and taking companies through different stages of growth. I’ve had the opportunity to participate in these processes at public companies like Microsoft as well as startups like Cruise and Headspace. I’ve now shifted my focus to executive consulting (fractional CTO/CPO, Advisor, Coach), where I help early-stage companies to launch their products and later-stage companies to scale without breaking.
My Holistic Framework for Team Effectiveness
Based on my experiences as a leader and consultant, I can say with confidence that one of the most impactful things you can do as a leader is to take a holistic approach to measuring your team’s effectiveness. Many tech leaders believe that DORA metrics (deployment frequency, lead time for changes, change failure rate, and time to restore service) are all they need. While DORA metrics do have their place in your toolkit, they only show you one piece of the puzzle.
Part 1: The 3 buckets (WHAT | HOW | WHO)
I recommend thinking of measurement across the three themes of what (strategic impact), how (execution and operational excellence), and who (team dynamics). Another way of phrasing this is the 3 P’s —product, process, and people. Let’s take a closer look.
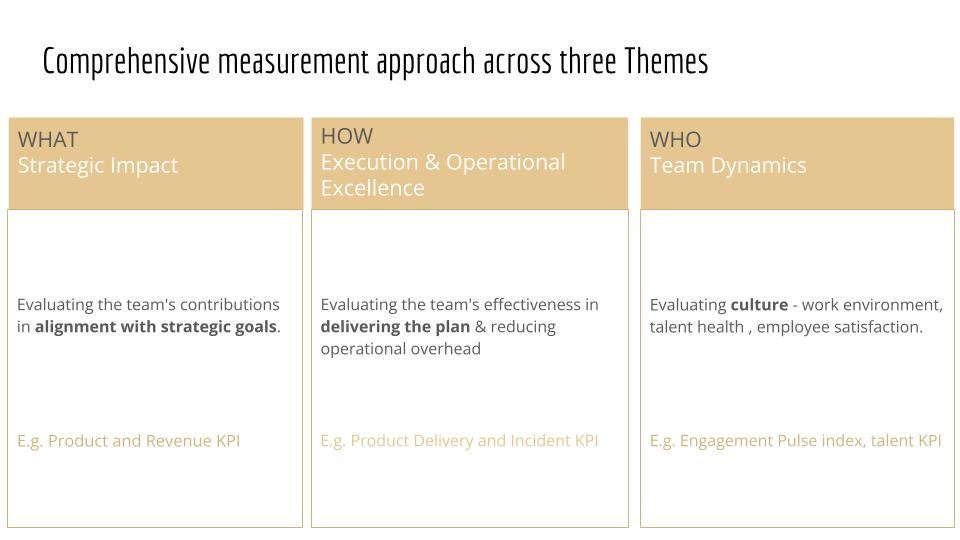
Here’s a quick overview of each category.
WHAT strategic value is the team delivering?
This measures how you performed in relation to your business and product goals
In other words: how much impact the engineering team has on the business
Examples: usage metrics, revenue KPIs…
HOW is the team executing and delivering it?
This measures how quickly and efficiently you are delivering and hitting your milestones
In other words: how good and efficient are we in delivering
Examples: product delivery, incident KPIs…
WHO is doing it and contributing to it?
This measures your team's pulse
In other words: from a human perspective, are we operating in a sustainable way
Examples: Engagement Pulse Index, talent KPIs…
Part 2: Measurement and Follow-Through
In addition to thinking about these three themes of what, how, and who, I also believe it’s important to combine measurement (typical metrics that shouldn’t be too surprising to any leader) with follow-through techniques. These follow-throughs are important to ensure you loop back and discover what’s working and what’s not. When you build follow-throughs into your process, they cause you to ask whether you’re having the impact you anticipated on your chosen metric. Follow-through techniques are also a great way to realize whether you are measuring the right thing or not. That feedback loop might lead you to update the metric itself next time around. You’re building an opportunity for reflection and iteration into your process. We’ll look at specific examples of follow-throughs a bit later.
Why Measure Team Effectiveness?
You might be wondering “why” it’s so important to put such a comprehensive measurement process in place. As Simon Sinek says, it’s critically important to “start with the why.” Let’s examine a few of the primary reasons.
At its most basic level, putting metrics in place gives our teams guardrails and a destination to aim for, what’s sometimes referred to as a North Star.
For engineering teams in particular, there is often a disconnect and a lag between the work we’re doing every day and the impact we’re having on the business. Unlike a salesperson, who is directly bringing in revenue with every deal they close, engineers may work on a feature for a month before it’s released to the public. And by that point, they’re likely already building the next thing.
As an engineering leader, you are responsible for helping bridge that gap for your team by regularly reminding them of how their day-to-day work connects with business goals, and how the business is doing in any given measurement period.
But to drill down further, measuring team effectiveness has four major outcomes: it serves the business, motivates employees, optimizes resources, and drives excellence. Let’s look at each one in more detail.
Serving the business: You can see how the team is contributing to the company’s top line. For example, at Headspace, measuring the impact helped us see the need to diversify and expand our product offering so we could expand our customer base and have recurring sticky revenue through the enterprise route vs. the consumer channel that had higher attrition.
Optimizing resources: Tech resources are a significant item in the balance sheet, so as a leader you’ll frequently be looking for ways to optimize and do more with less. At Cruise and Microsoft, for example, we were able to drive consolidation and remove overlap, which helped us deliver more with the same people and software resources. A note of caution: Engineers will push back for measuring execution metrics, but that's where this WHY is helpful, to have alignment.
Motivating employees: There is no better motivation stick than showing the ugly truth that data reveals. At Microsoft when we launched Azure Machine Learning and analyzed the funnel drops, it motivated the team to proactively shift their plan and prioritize growth initiatives that led to 30% funnel optimizations.
Driving excellence: The only way to become outstanding is by measuring where you are now and defining where you want to be so that you can plan how to get there. This in turn helps talent to be constantly upleveled and ensures you attract and retain the right people.
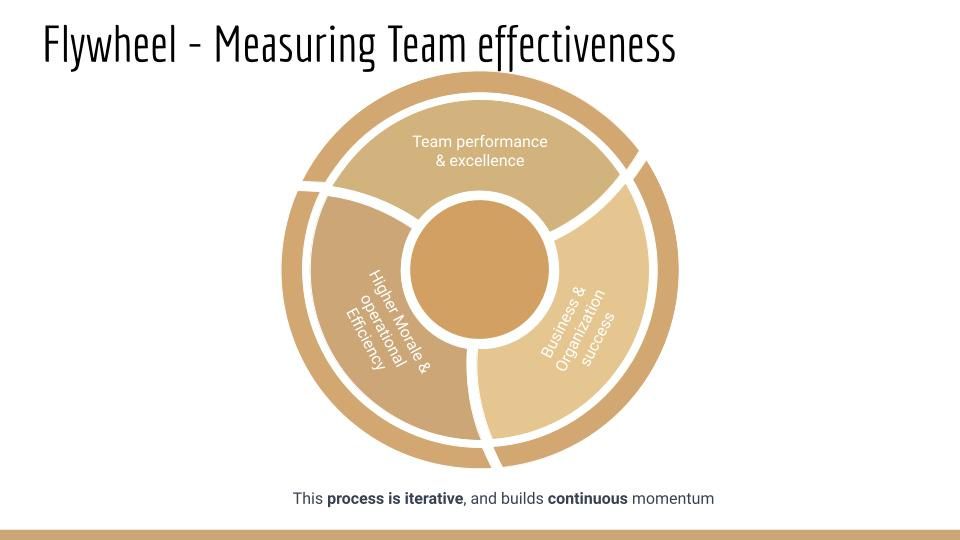
Measuring team effectiveness creates a flywheel, where team performance and effectiveness drive business and organizational success, which drives higher morale and operational efficiency. This is an iterative process that builds continuous momentum.
Where Should I Start with Engineering Effectiveness? 4 Key Points to Keep in Mind
Before we dive into my specific recommendations for metrics and follow-through techniques for each theme of what, how, and who, I want to share a few guiding principles for you to keep in mind.
Start simple
You don’t need to build the full engine and don’t need to wait to implement fancy tools. Go with your best guess. It’s much better to get started sooner rather than later, and there’s nothing wrong with a simple approach. You can always automate by layering tools as you expand your metrics footprint.
Pick three to five metrics per period
You don’t need to go overboard with choosing a large number of metrics—just choose three to five to focus on per measurement period (whether that’s a quarter, a month, etc.). Just make sure you pick at least one metric from each category. This is important because people will often gravitate towards only the “how” metrics since those are the most familiar to us. All three categories matter!
Use the follow-through techniques
I’ll be giving specific examples of follow-through techniques for each theme in later sections of this article, but for now, I just want to emphasize the importance of using the follow-throughs. Because this is an iterative process, the follow-throughs help you make sure you’re measuring the right thing. They may also show you that you need something deeper, finer, or just different than what you’re currently doing. That’s okay! You’re building up your quiver of metrics by iterating and using the follow-through processes to investigate.
Revisit every period
Spend time reviewing your metrics and follow-throughs from the previous measurement period and deciding the next three to five you’ll be focusing on for the next measurement period. Keep in mind you may be eliminating some metrics and keeping others. It’s not about always keeping the same metrics quarter after quarter, year after year, but fine-tuning what’s best for your team to focus on and drive change right now. Businesses change, teams change, and priorities change, so the way you measure your teams should also change.
Let’s now dig into each bucket:
The What: Strategic Impact
Now we’re ready to look at the first category: the what or strategic impact. As we dive deeper into each category, I’ll share the metrics, the follow-through techniques, and specific examples from my experience.
Metrics for Strategic Impact
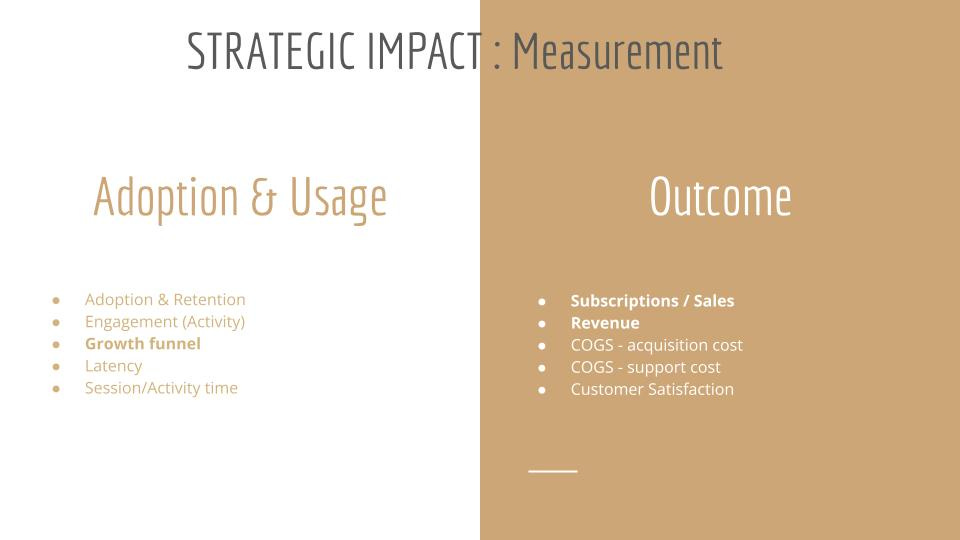
Measuring strategic impact to evaluate team effectiveness is akin to using a compass in uncharted territory. It ensures your team is on the right path and aligned with the organization's objectives.
The measurements are across adoption & usage and the intended outcome. In the slide above, I’ve given a few examples of ways to measure adoption & usage (such as retention, engagement, and growth funnel) and outcome (such as subscriptions/sales, revenue, and customer satisfaction).
Teams sometimes get fixated on adoption without inspecting if it is helping the end goal. For example, the adoption of an app like Headspace is not sufficient if the end goal of member mindfulness and happiness is not attained. That’s where subsequent metrics of frequency and completing the desired activity help out as well as doing surveys to measure the end impact (in this case calmness, happiness, etc.).
Example: Strategic Impact Metrics at Headspace
Let’s walk through a more detailed example of how we drove 70% efficiency in the growth funnel at Headspace. In this case, we focused on first scaling the basic metrics with integrated tooling across various marketing and product analytics tools to get specific detailed metrics across the funnel. We were at the stage where we needed detailed metrics end to end to track how marketing efforts contributed towards the growth and hence introduced various tools like mParticle, Braze, Amplitude, etc. for data insights across different sources. An important lesson here: Keep an eye out and learn to understand when to scale tooling.
In the next phase, we debated and analyzed which specific KPIs to pick. Another important lesson here: Don’t underestimate and definitely don’t skip this step. This is part and parcel no matter which stage of your company because even if you are aligned with the top line KPIs, you will have this discussion in various secondary levels.
Example: Strategic Impact Metrics at Headspace
Working cross-group for growth was crucial—aligning KPIs and initiatives across finance, marketing, data, product, and eng groups. When diving into the subscriptions and revenue KPI with the cross-group, we noticed teams had different definitions and different logic, e.g. for lifetime value, cost per customer, calculation of revenue from web vs. app store, etc. It was only when we worked cross-functionally that we were able to get aligned on the right KPIs and their definitions.
Follow-through Techniques for Strategic Impact

The next phase, following through, involves both qualitative and quantitative check-ins. Both approaches are equally vital—qualitative check-ins allow you to experience customers’ problems firsthand and quantitative check-ins help you see the aggregated impact.
As I’ve shown in the slide above, qualitative check-ins can include things like the voice of customers and customer shadowing.
Example: Strategic Impact Follow-through Technique at Cruise
Looking at a more specific example, customer shadowing was a high priority at Cruise, and the key to its success was that leadership was committed to modeling this behavior. We would broadcast live virtual customer shadowing during all hands on a regular basis and present one customer highlight and one pain point/learning to remind ourselves to be humble and continuously learn and grow.
Example: Strategic Impact Follow-through Technique at Headspace
Quantitative check-ins can include things like recurring product metrics reviews and hypothesis validation during project milestones. At Headspace, during a project milestone check-in, the team was evaluating how an experiment performed against a hypothesis. We realized the KPIs we’d picked were not helping us validate the usefulness which we discovered when we were trying to analyze the outcome. At this stage, we understood that we needed to drill down further and have more detailed and specific metrics. As part of our analysis, we also discovered some bugs in the metrics and some flows were missing attribution towards the metrics. This is a reminder not to skip the step of reviewing KPI requirements just as you would for feature requirements and testing KPIs.
The How: Execution and Operational Excellence
In the previous section, we covered measurements to assess what the team is delivering. In this section, we’ll cover measurements of how the team is delivering.
Metrics for Execution and Operational Excellence

Measuring how we are delivering against the plan is like taking your car in for a routine inspection—it helps to assess and address any potential issues before they become major problems.
As I’ve shared in the slide above, you can consider these metrics in terms of execution (how your team is performing, measured by things like velocity and planning) and operation (how your systems are performing, measured by things like stability and incident analysis). DORA metrics—comprising deployment frequency, lead time for changes, change failure rate, and time to restore service—have become the industry standard in this regard.
Example: Execution & Operational Metrics at Headspace
I want to share a counterintuitive scenario that worked for us at Headspace that also serves as a reminder that velocity is not always about going fast—sometimes you have to go slow first to go fast later. We were seeing an increase in incident spikes due to quality issues (70%) and this downtime, in turn, contributed to subscription failures impacting revenue. This was fixable, but we had to take a hard stand and make a tough decision to pause all releases to prioritize automation quality gates and to have confidence and reduce incident outages. It took us a couple of months, but it gave the team a breather to focus on it and brought that well-needed culture shift and accountability across all functions. We put together incident metrics and sliced them by those due to quality and those that were manually detected. This was a huge eye-opener, so we set goals and plans to combat that. We set the target to bring down our incidents due to quality from 70% to 15% and bring down manually detected incidents from 80% to 20% with a focus on automation and actionable alerting. This drove the right prioritization.
Follow-through Techniques for Execution & Operational Excellence
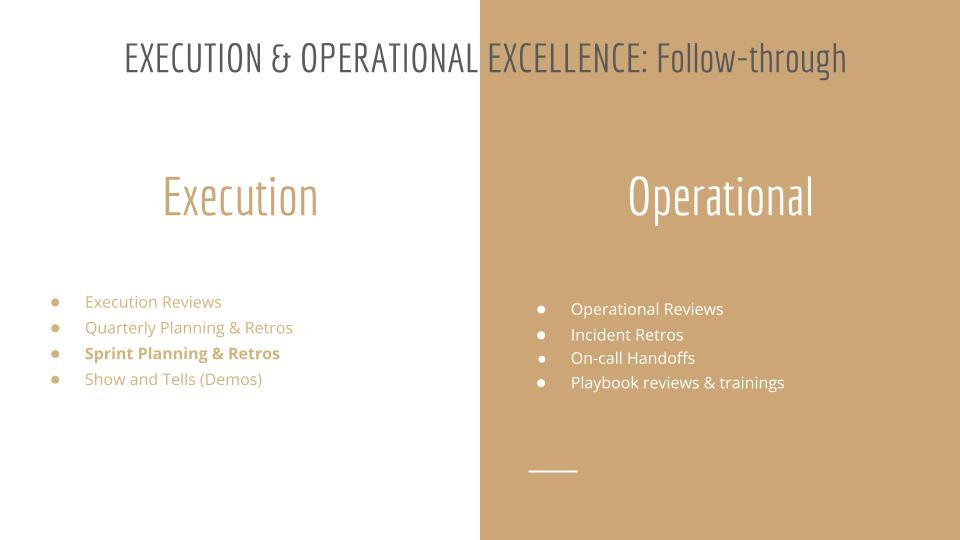
There are multiple checkpoint options to follow through on execution and operation. The most standard ones are execution reviews and operational reviews, but I’ll share a few other examples from my experience.
Example: Follow-through Technique for Execution & Operational Excellence at Cruise
With sprint planning and retros, I embrace the model of keeping it simple. At Cruise, we drove 30–40% efficiency across sprints by looking at standard sprint metrics such as burndown and velocity across all teams and having individual teams review and incorporate it during sprint retros. This helped drive improvements in ticketing across estimation, dependencies, and requirement/scope specificity, which in turn resulted in more on-time completion.
Just like with any change, the team was resistant and pushed back at first, but eventually, team leads began to see the fruits of their efforts and how it helped them and the team to have a confident plan and surface cross-functional dependencies in ways to avoid risks.
I also witnessed another counterintuitive scenario, which is that qualitative measures were equally as powerful as quantitative ones. For example, having recurring “show and tell” where the team showcases their in-progress work helps not just execution, but knowledge sharing and team morale by celebrating the wins. We saw the immediate impact of faster incident resolution (improvement of more than 50%), as team members had seen some of the demos and could connect the dots during the incident.
The Who: Team Dynamics
In the previous section, we covered measurements of how the team is delivering. In this section, we will cover measurements around who or the talent on your team and within your company.
Metrics for Team Dynamics
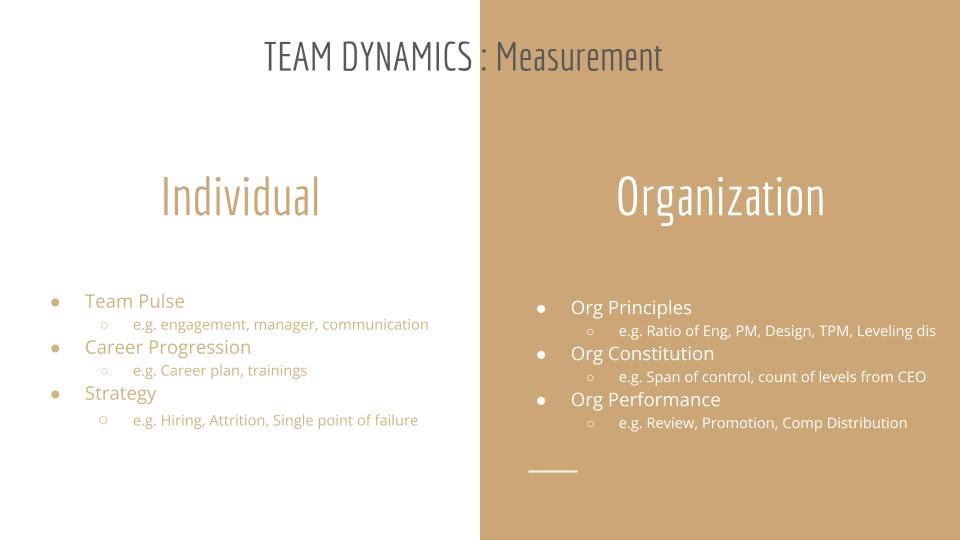
The right people are our greatest asset, and as a leader, you need to cultivate the right environment for people to succeed. If you put too many fences around people, you get sheep.
So how do you assess whether you have the right people on the bus and have the right culture to empower and drive innovation? This involves leveraging a mix of quantitative and qualitative assessments on both an individual and organizational level, as shown in the slide above.
Example: Team Dynamics Metrics at Headspace
Looking at a specific example from Headspace, a Glint survey revealed that career and retention were areas of opportunity. Since managers are the face of the company for our talent, and some managers were new, we chose to drive initiatives to empower and train our managers. These actions resulted in a nine-point improvement in the management score. Some of the initiatives included a manager round table following the lean coffee model to address topics like “what’s keeping you up at night,” which facilitated sharing insights, learnings, and support. We also did an unconscious bias training and practical exercise on problem-solving inclusion challenges with examples we had collected from the team.
Example: Team Dynamics Metrics at Cruise
It’s also important to assess whether you have the right people in the right places—and that’s where organization principles and constitution come into place. At Cruise, we had outlined the principles around span of control, number of levels from CEO, and ratios across PM/Design/TPM/Eng, etc. This was very helpful for guiding us in our hiring strategy as well as reorg strategies. This is especially beneficial when you are going very fast to ensure you’re making decisions that are measured and aligned with your overall strategy.
Follow-through Techniques for Team Dynamics
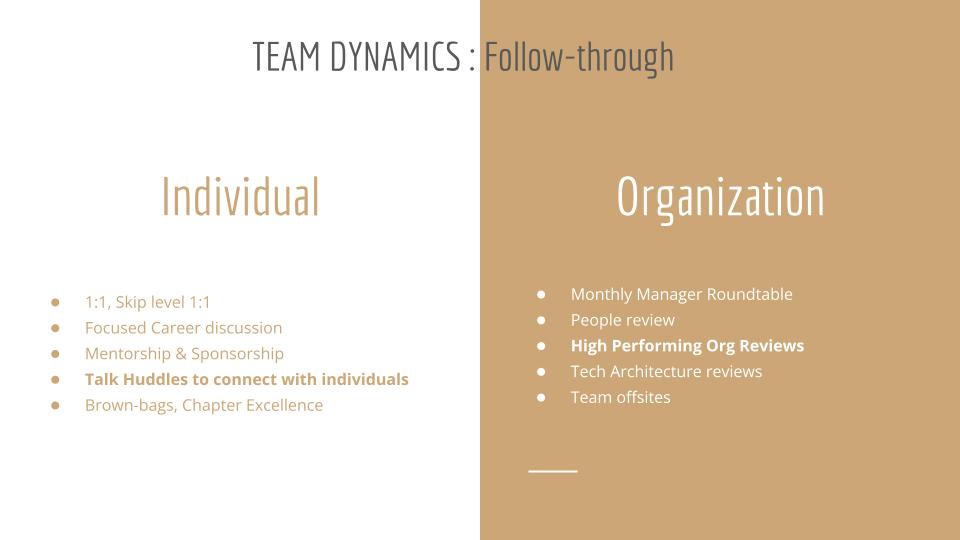
Following through on team assessment is important, but often put on the back burner. Don’t let this happen to you!
As I’ve shown in the slide above, there are several ways you can do this for both individuals and organizations, including through 1:1s, mentorship, monthly manager round tables, and high-performing org reviews.
Example: Follow-through Techniques for Team Dynamics at Cruise
One follow-through that helped me scale communication while keeping a pulse was doing talk huddles at Cruise. The way I organized this was by periodically meeting groups of around five individual contributors to share what was top of mind for me. I’d also take this opportunity to learn from them what to start, stop, and continue. These dialogues helped us build relationships and learn where communication was breaking down.
Example: Follow-through Techniques for Team Dynamics at Headspace
High-performing org reviews were another approach that was very helpful at both Cruise and Headspace. This allowed us to take a step back and be strategic, viewing the whole picture across org health, workforce landscape, org structure, and talent composition.
Wrapping Up: What’s Next?
If you’re looking for specific steps to take, I’d recommend revisiting the earlier section, “How Do You Measure Team Effectiveness? 4 Key Points to Keep in Mind.” Here’s a quick refresher:
Start simple
Pick three to five metrics per measurement period
Use the follow-through techniques
Revisit every period
And here are a few additional pointers to help you get started: Look at the focused KPIs that apply to your team’s situation and then have your execs lean into it. For example, the focused KPI of bringing down the count of incidents detected manually drove huge improvements in alerting, its thresholds, and playbooks, which brought down MTTR.
You don’t need any fancy or special tools to get started. In some cases, all I needed were simple Google forms and spreadsheets. It’s easy to scale subsequently, so don’t get blocked or fixated on having “the right” tools or people. Perfection is your enemy.
Encompassing cross-functional groups and their areas to see the bigger picture is essential for ultimate optimization. We drove 25% improvements in execution by optimizing non-eng workflows, e.g. parallelizing projects and ensuring kick-off is done as soon as the first project requirements are done. We also time-boxed design deliverables to avoid elaborative designs and ran various prototyping tests to validate hypotheses without waiting on eng.
Some final words of advice: Make sure you stay positive. Be curious and lead with questions—remember, this is an iterative, learning journey. Cultural shifts take time and require overcommunication. And don’t forget to celebrate the wins along the way! When you move the needle and make progress, make sure everyone knows it. This will help your teams to stay motivated and engaged.
And that’s a wrap! As usual, two questions to improve our post:
Thanks in advance for your feedback!
Quang & the Plato Team


