#11 - Transforming DigiCert's organization to achieve 99.99% uptime | Wade Choules, SVP Engineering
In engineering and poker, it's always good to have four nines.
Hey there! Welcome to our eleventh article about Engineering Leadership, written by another world-class leader. This week, we’ve invited Wade Choules, SVP of Engineering at DigiCert, and Plato mentor. He’ll show you how to achieve four nines uptime in a detailed guide below!
If you’re not subscribed yet, you know what to do:
Let’s go!
Wade Choules, serving billions of users every day
You may not know DigiCert, even if the chances you used their services are huge. DigiCert is powering thousands of websites with their SSL certificates, making the web a more secure place. Their service secures around 28 billion web connections daily and is used by 89% of Fortune 500 companies. Any service interruption can affect millions of people — and achieving at least 4 nines is necessary. Wade Choules knows this better than anyone and made this one of their focuses at DigiCert.
Here’s more about Wade: he has a 20-year-long career in tech and spent the last 10 years at DigiCert, where he currently serves as a Senior Vice President of Engineering. He leads a global team in delivering innovative and secure digital trust solutions. His contributions to DigiCert's growth and success include overseeing various projects such as developing new cloud-native products, integrating acquisitions, and enhancing customer satisfaction. Wade's mission is to empower his team and clients with cutting-edge tools and technology to ensure trust and reliability in the digital world. He values collaboration, innovation, and excellence, and is always seeking new challenges and opportunities for learning and growth!
You can learn more about Wade Choules on LinkedIn.
How we are transforming the org to achieve 99.99% uptime at DigiCert
How did DigiCert undergo a transformation that allowed us to achieve 99.99% uptime? I’m Wade Choules, SVP of Engineering at DigiCert, and I’m here to walk you through our story.
First, a little bit about me: I’ve been in the tech industry for 20 years and worked in a variety of roles including IT Systems Admin, QA, Software Engineer, and Software Architect, and for the past 6 years I’ve been in leadership roles at DigiCert.
If you’re not familiar with DigiCert, we’re the leading provider of digital trust. We’re a global company with 1,500+ employees and 250+ in the Engineering org. Our products are used by 89% of the Fortune 500 and 99 of the 100 top global banks.
To describe our work in more detail, we’re the world’s leading provider of scalable SSL, IoT, and PKI solutions for identity and encryption and we secure more than 28 billion web connections every day.
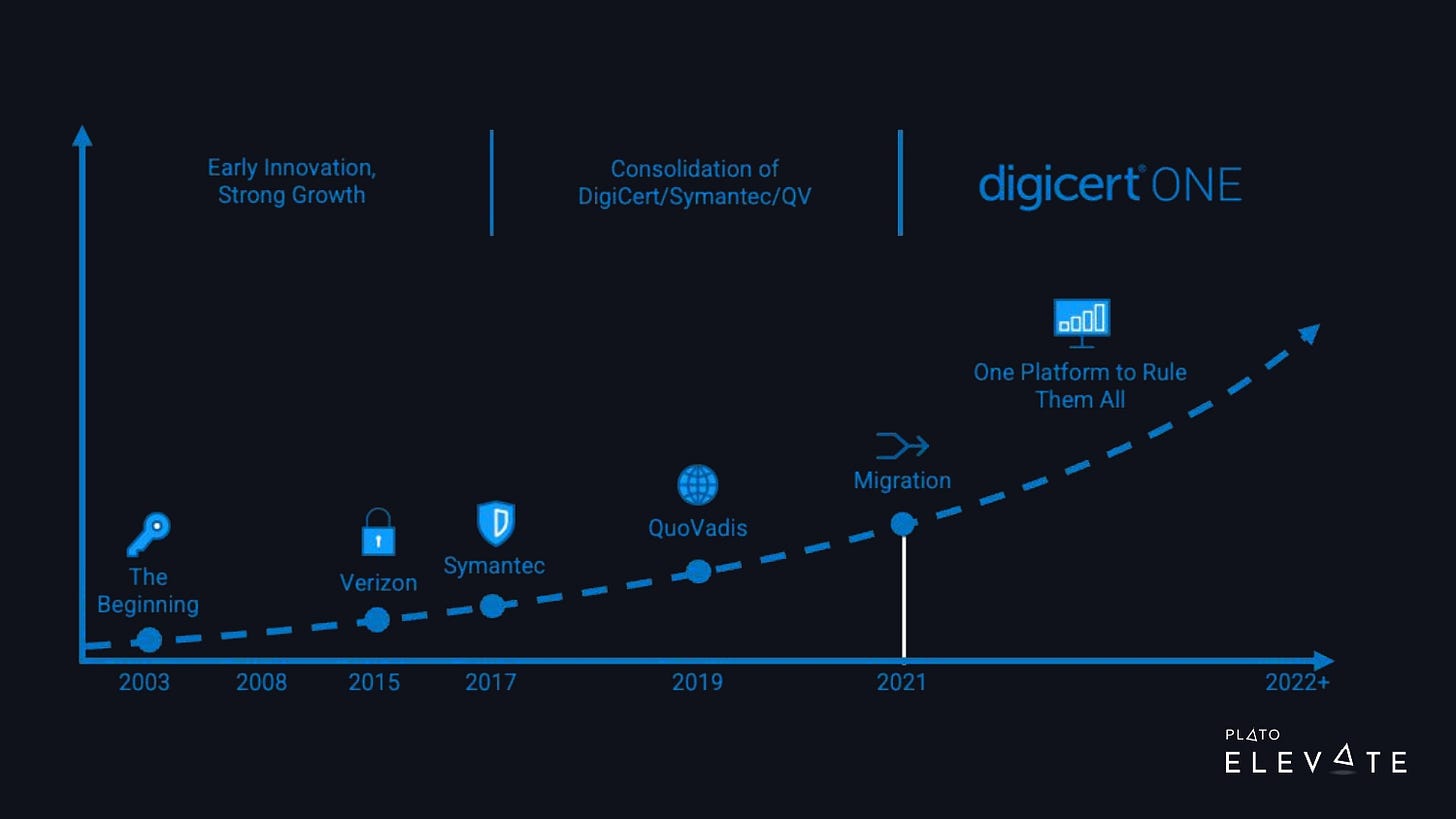
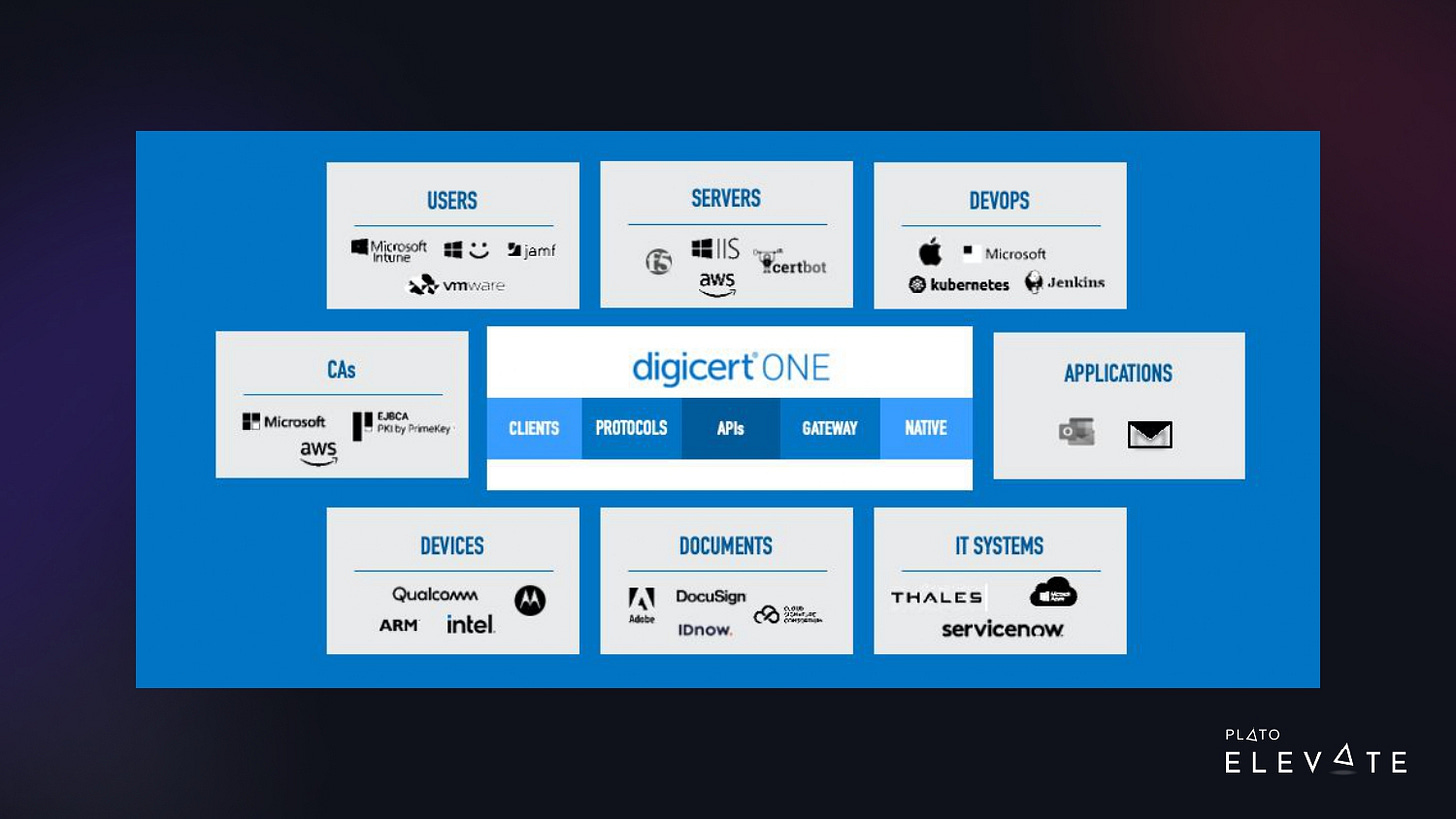
Over the last few decades, DigiCert has made several acquisitions. In 2017, DigiCert acquired Symantec’s web trust business, which more than quadrupled the size of our company. We went from about 300 employees to 1,500. We’ve worked on consolidating all of these products into DigiCert ONE, part of a much larger trust ecosystem, as shown in the image below.
With this digital trust platform, we can integrate the installation and management of digital certificates on user devices for:
securely authenticating to corporate resources
sending secure emails
digitally signing documents
With this same platform, we can automatically install publicly trusted TLS certs on web servers and load balancers and secure IoT devices. These are critical use cases for our customers, so we need to have it up and running 24/7.
Digging into the problem: The trigger
“If we are down, our customers are down”
DigiCert has several very large enterprise and IoT customers. These large organizations use our products to issue digital certificates for a variety of mission-critical workloads. Here are just a few examples:
An IoT device manufacturer needs to install a certificate on every device at manufacture time. If our service is down, it could shut down the device manufacturing line, causing costly delays for our customers.
We have enterprise customers who provision digital certificates for every employee to authenticate to their corporate resources such as the VPN or Wi-Fi network. They also issue S/MIME certificates for sending and receiving trusted and encrypted email communications.
DevOps groups spinning up web servers need immediate and automated issuance of TLS certificates.
To sum up, a lot of critical business functionality is tied to our services. If we are down, our customers are down.
Back in 2020–2021, the engineering team was aware of the impact outages were having on our customers. As with most engineering organizations, there are a lot of high-priority projects and very tight deadlines competing for limited engineering resources. The engineers knew the gravity of the situation, but they needed the time and space to work on issues that were causing outages. DigiCert needed to make it THE high-priority project.
Customers were being vocal about outages and expecting that DigiCert would work toward achieving 99.99% uptime. Outages and uptime are critical parts of contract negotiations with customers.

I should also mention that our product portfolio is a mix and match of products at different maturity levels: legacy, new, and acquisition. Some of our key legacy products had more downtime than they should.
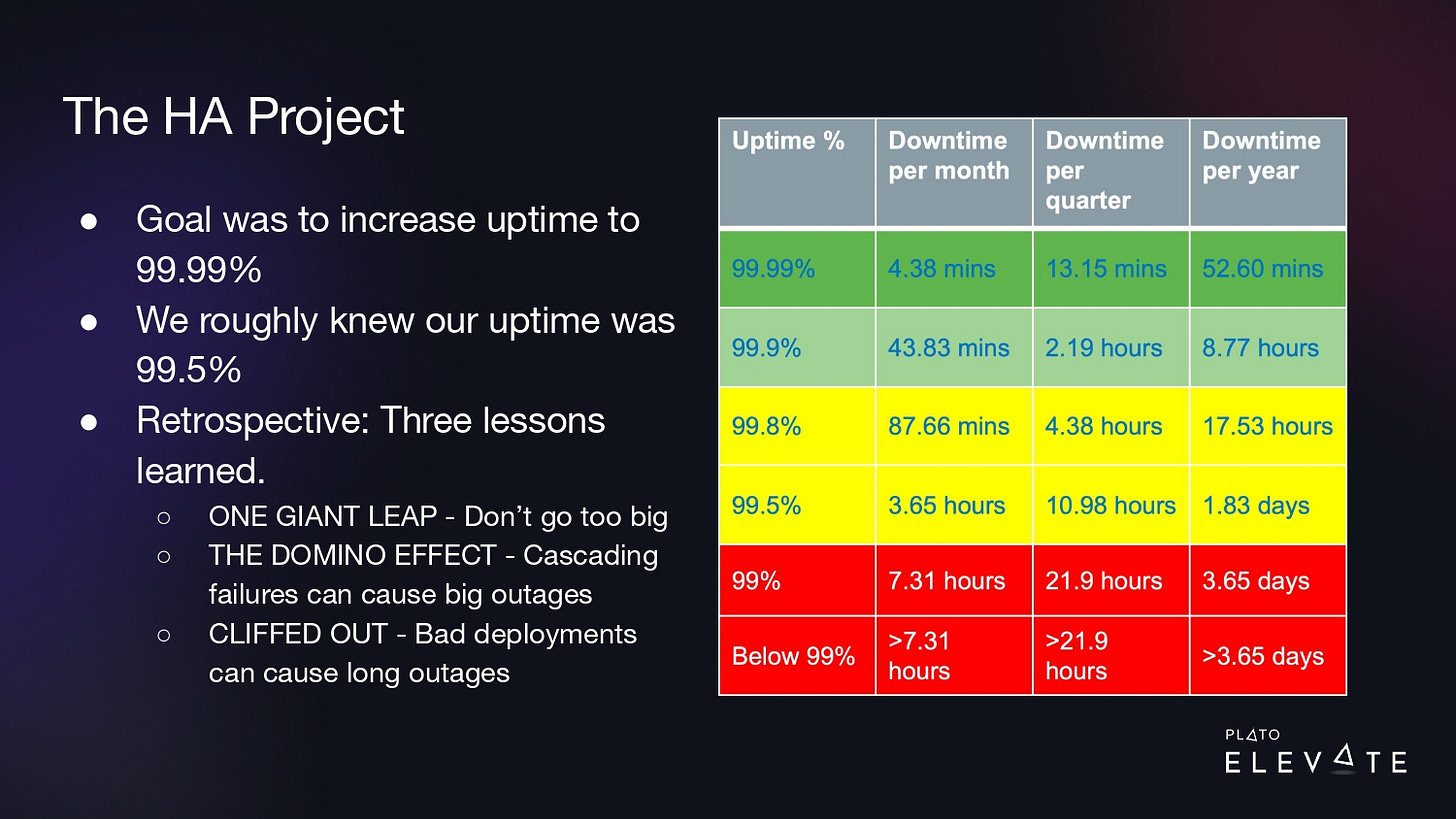
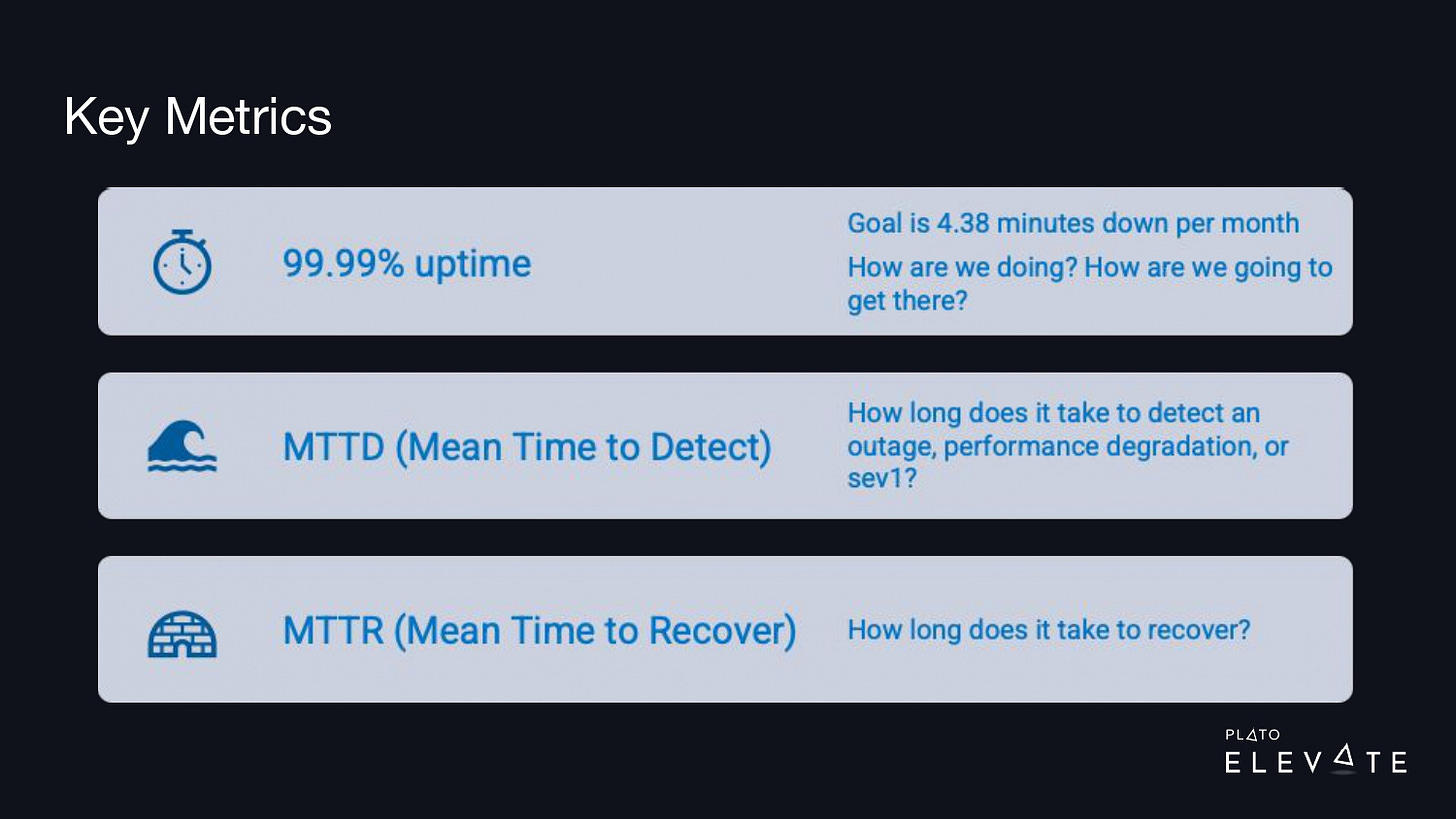
At this time, we decided to kick off a high-availability project, which we referred to as “the HA project.” The goal was to increase our uptime to 99.99%. At the time, we didn’t have a great handle on what our uptime was, but our rough estimate was 99.5%. What that meant was we had to go from 3.65 hours of downtime to less than 5 minutes per month.
Throughout the rest of this article, I’ll share a retrospective of four lessons we learned that had the biggest impact on decreasing our downtime.
Step 1: One giant leap
Right off the bat, we wanted to go big. We started with the assumption that the only way to achieve higher uptime was by doing multi-region active-active deployments, which meant our applications needed to be running in multiple data centers at a time, so failures in one data center wouldn’t impact the customers. The traffic would be routed automatically to another data center in another region.
We knew from where we were standing that this was going to be a lot of work and we needed a lot of uptime ASAP.
Here’s where we found ourselves at the beginning of our project:
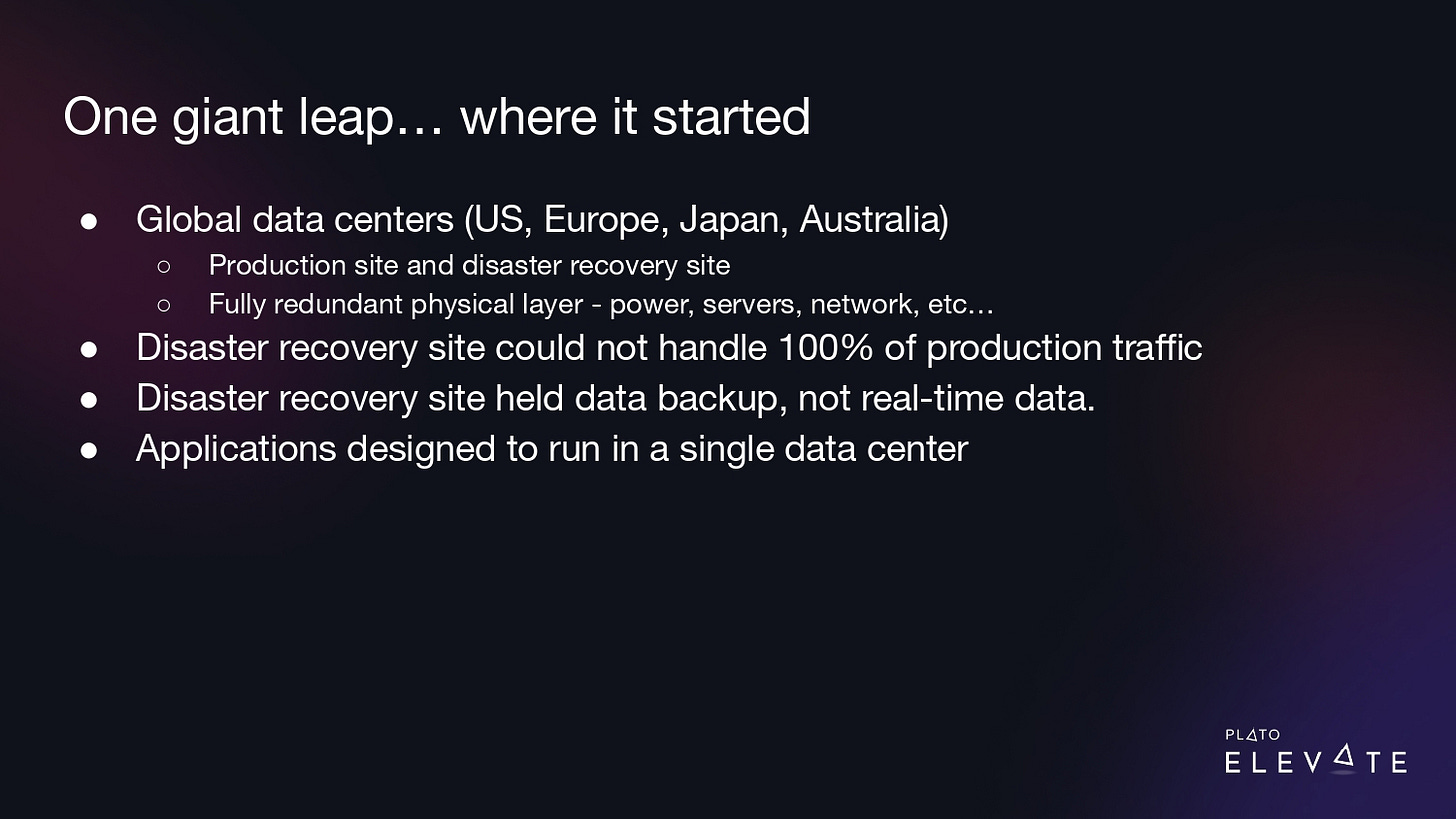
We were pretty well-placed with our data centers. We had them around the world, in the US, Europe, Japan, and Australia. They were set up in a production and disaster recovery configuration and all of our recovery centers were fully redundant at the physical layer, power, servers, and networks.
The disaster recovery sites were geographically located a large distance from the production site with high latency.
Our disaster recovery site wasn’t as big as our production site. They didn’t have the same level of computing power and couldn’t handle 100% of the traffic.
Also, we didn’t have all our real-time data available on our disaster recovery site. It mostly held backup data.
And the last point—which is key—is that our application architecture was set up in such a way that it could only run in a single data center, so if we needed to fall over to our disaster recovery site, we had to shut down one instance and spin it up in our disaster recovery site, so only one instance of our product was running at a time.
I think that at this time, there was a fundamental assumption that to achieve 99.99% uptime we had to have all our services running active-active in multi-region data centers. This thinking was largely to account for infrastructure issues, such as loss of power or network services to one data center and even a natural disaster. We knew other large tech companies used a multi-region active-active architecture and that was why they were able to handle any issue from a basic server/application issue to a large power outage and still maintain high uptime.
The issue is that rewriting/re-architecting all our services to handle an active-active data center architecture across multi-regional data centers was going to take a very long time with no immediate benefit to our customers or business. We had this mindset for one to two quarters.
We got to work. Over the next couple of quarters, we made some real progress. We added computing power to our disaster recovery sites. We set up real-time (or near real-time) database replication from production to disaster recovery. And we took extra steps to automate our deployments on both of those sites.
“We needed to think more iteratively and use data to address our immediate downtime issues to get quicker wins”
This was already a lot of work and we’d already spent a lot of time on it, but we still had one big issue: We needed to re-architect our products to be able to work in multiple data centers and we still needed to deal with big architecture concerns like eventual consistency and event-driven design.
This was going to be another large project on top of what we’d already invested and we decided to settle on a different strategy. We decided to go active/passive. We were still going to run our apps in a single data center, but we’d reduce the amount of time it took to flip from one data center to another.
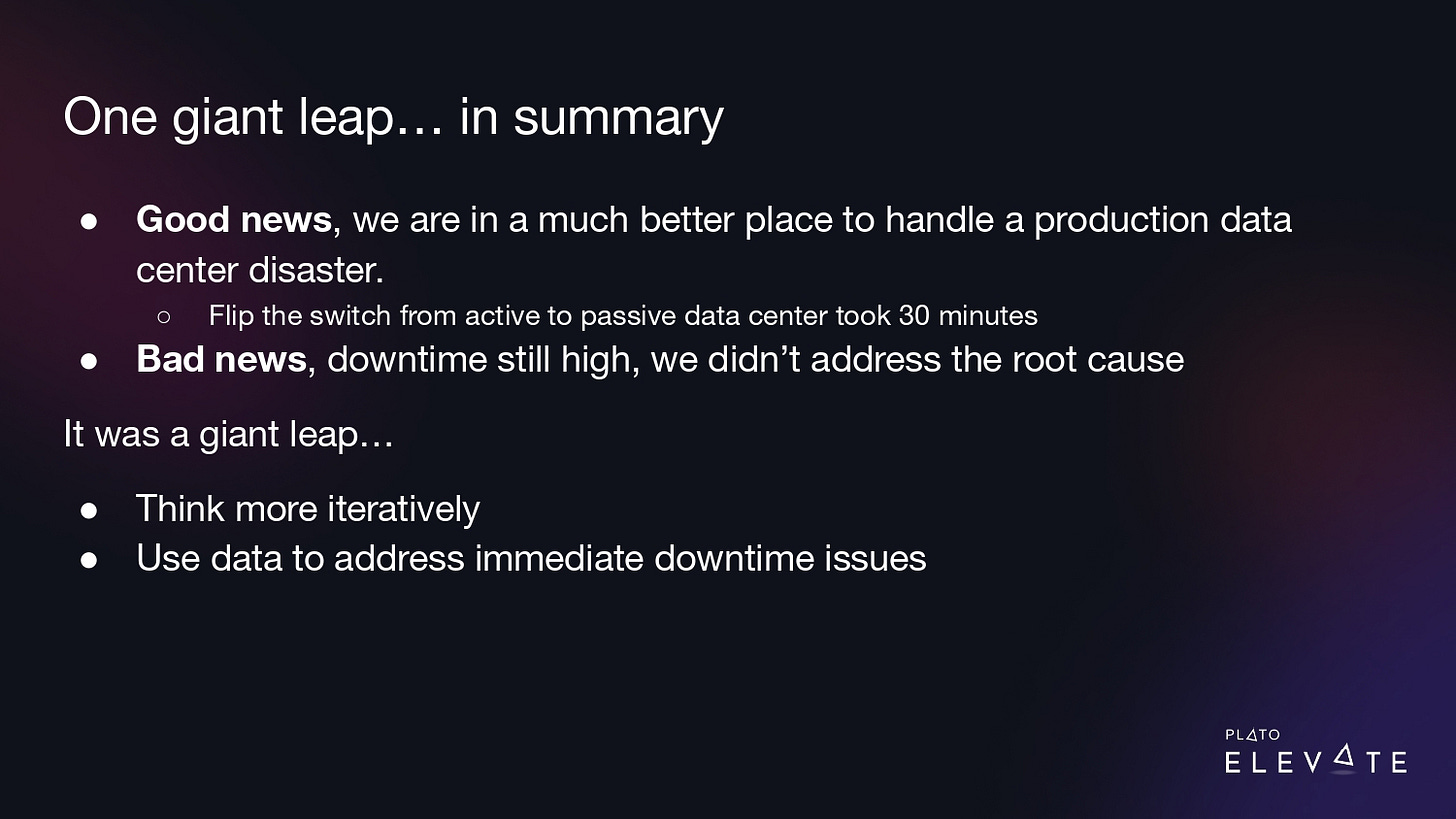
So what was the outcome? The good news was with this project, we were in a much better place to handle a disaster in our production data center. We could flip from one data center to another in less than 30 minutes. But the bad news was this was still way too long to achieve our downtime goals and we didn’t address the root cause.
This was a giant leap. We needed to think more iteratively and use data to address our immediate downtime issues to get quicker wins.
Step 2: Reflecting on our failure and looking into data and metrics
We realized that the data we had wasn’t sufficient to get to the root cause of the problem. We had monitoring and alerting that told us there was an outage, but we didn’t have a centralized way to collect information about incidents/outages. We still had the main goal of 99.99% uptime, but we also created an INCIDENT project in JIRA, and with every outage, we documented the timeline of events that led to the outage and we tracked the mean time to detect (MTTD) and mean time to recover (MTTR). Our goal was simply to get accurate measurements.
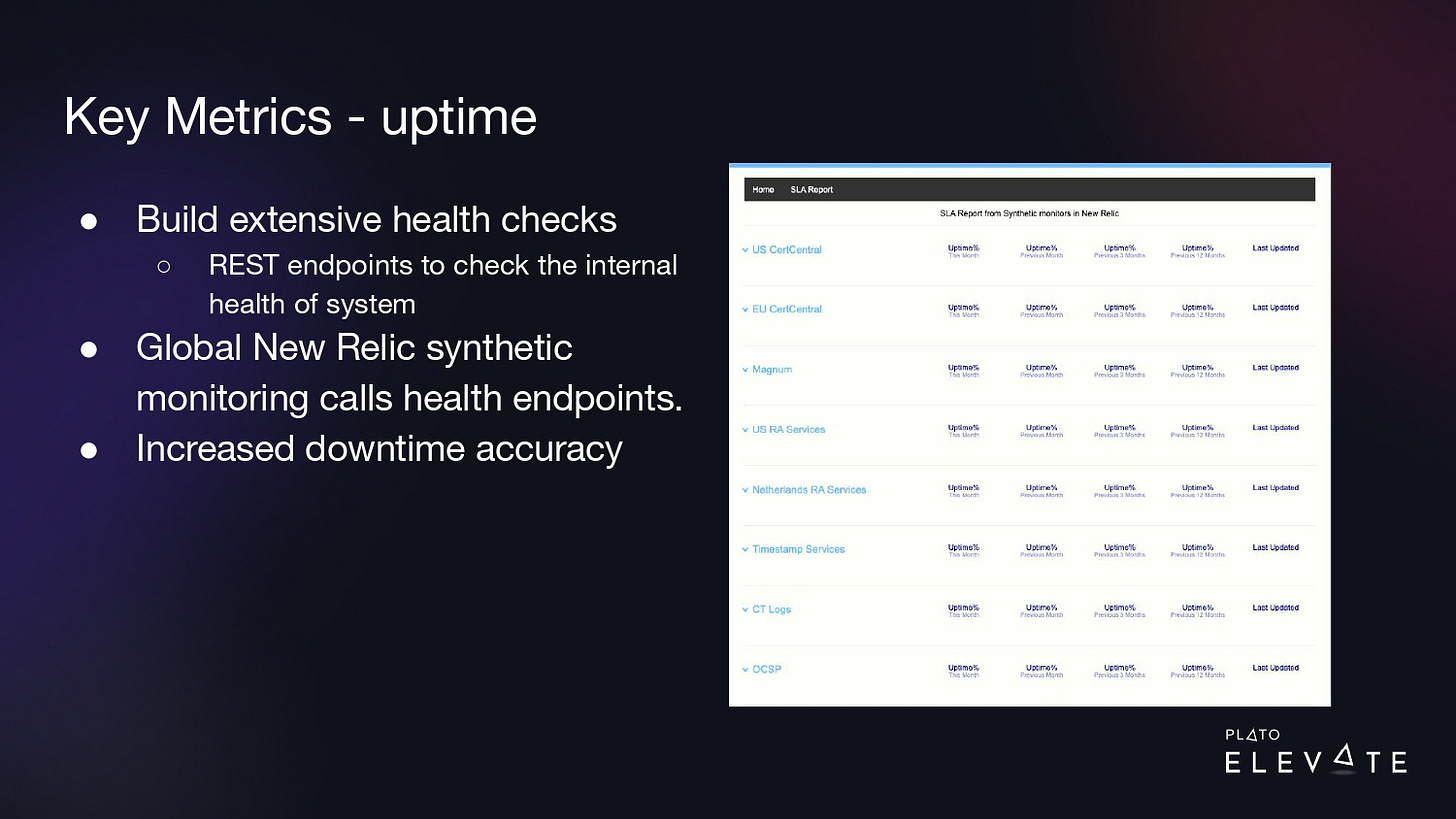
We also realized that our monitoring and alerting needed to improve. We had very basic checks. We invested in writing extensive health checks for each of our web services. This is a REST endpoint that runs multiple checks inside the application. All these checks are vital to make sure critical functionality for the web service is up and running.
Because these extensive health checks are for critical functionality, they are what we use to measure downtime. If one of the checks returns an error, we consider that downtime for the web service. These checks would catch a lock in the database, and if it was locked for one minute, it would be a one-minute downtime for that specific product.
We could hook these endpoints up to our global monitoring system called New Relic and it could run synthetic checks from multiple locations around the world. If any of these checks returned an error, we’d start getting measurements of downtime in seconds and we could build a dashboard like this where we could now trend our uptime from the last month, last quarter, and last year. This increased our accuracy.
For example, if product E is down, but ABCD is working fine, we would say that only E is down. Since our products are deployed in our data centers around the world, we measure uptime by product by region. If E is down in the US data center and not down in the EU, we would say product E is only down in the US.
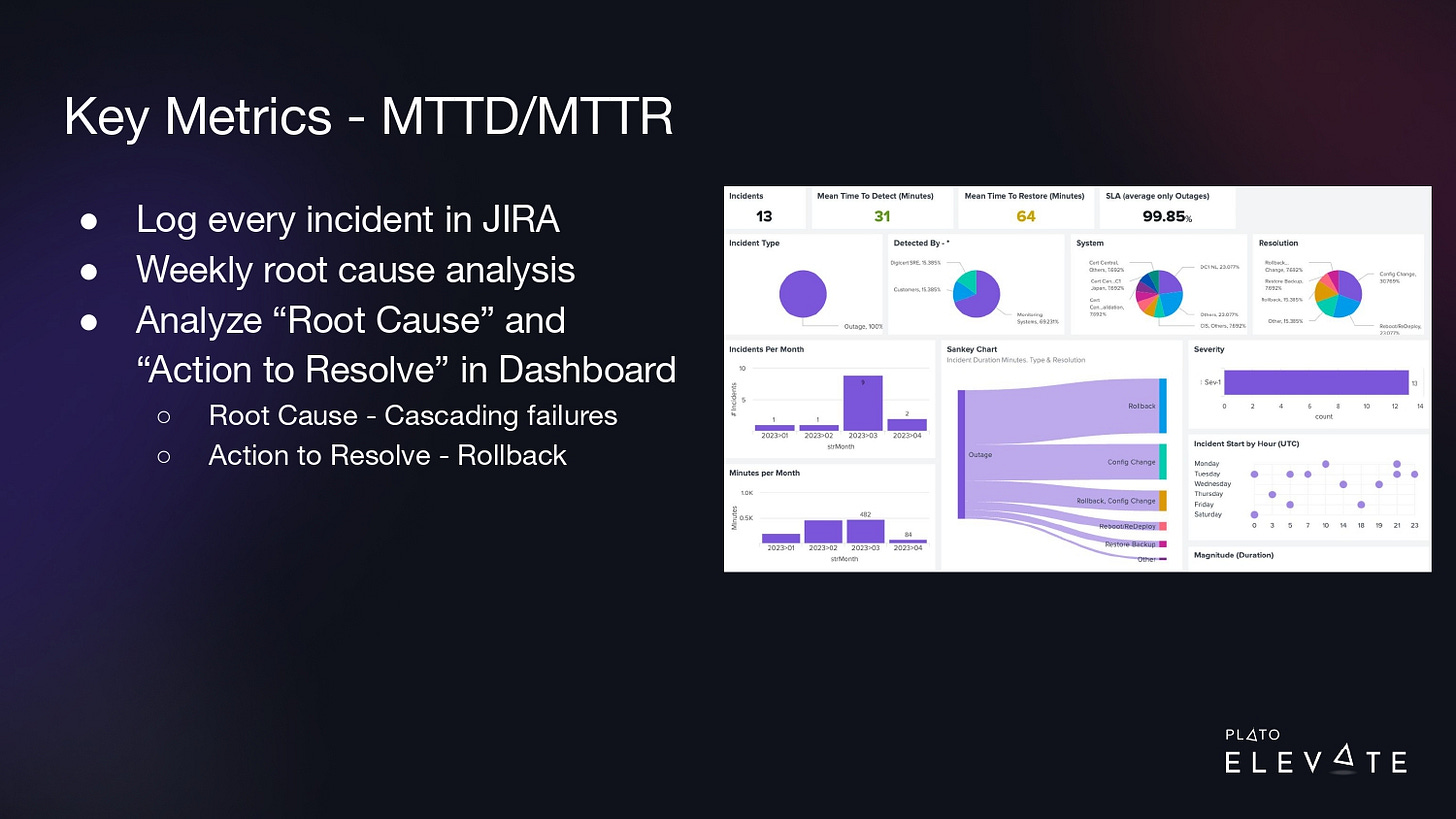
Now that we have this process in place, we’re able to pinpoint outages with these endpoints. Once a week when we would detect these problems, we’d log them in Jira, and we would do a root cause analysis to log the cause of the outage and the action we took to resolve it.
With a dashboard similar to the one shown above, we were able to trend over time to say we see a lot of cascading failures. A lot of our outages are caused by some system causing a failure in another system causing failure in another system. And a lot of time to resolve these, we needed to roll back whatever change was introduced at the time. This leads us to the next step…
Step 3: The domino effect—preventing cascading failures
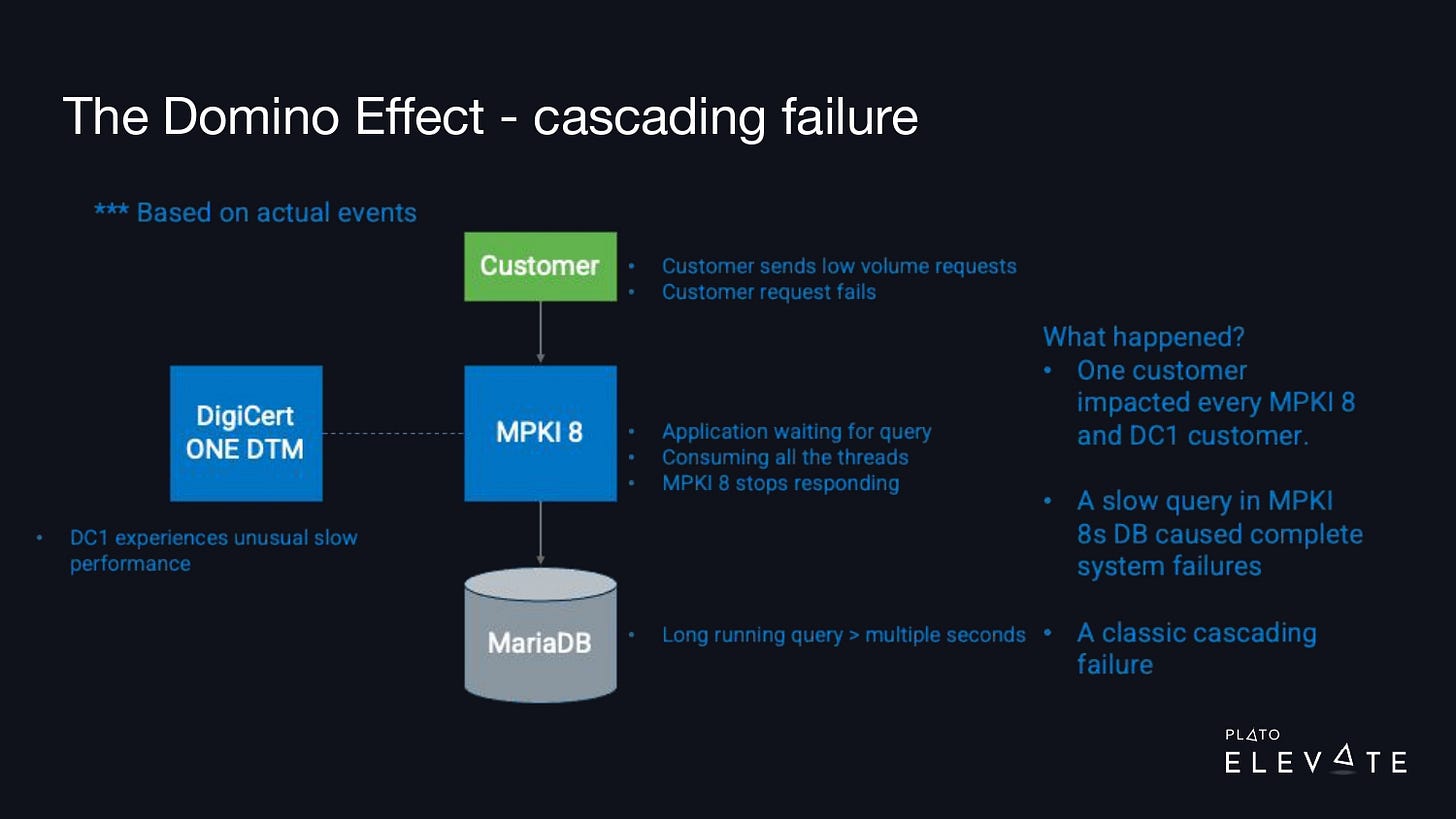
Our root cause analysis led us to some critical questions: How do you prevent one outage in one system from causing an outage in another? And how do you prevent one user from bringing down all of your systems?
The image above illustrates a typical outage that we’d see: one customer would call our product—in this case, it’s MPKI 8—and this request would send off a long-running query. The customer wasn’t making a lot of these requests, but they made enough that eventually it locked up the thread pool and consumed all of the resources on the MPKI 8 product.
Secondary to this, another product, DigiCert ONE Document Trust Manager, relies on MPKI 8, and because it was returning slowly, it was also starting to show outages and issues.
What happened is that effectively one customer was able to bring down all of these products and affect multiple customers at once.

Around ten years ago, I read a book called Release It! In the first chapter, the author describes a scenario where he worked for an airline. They released a new version of their airline booking and ticketing system and that change also had a long-running query issue. A few users were able to bring down this whole airline’s ticketing booking system, causing chaos and panic for the airline. What this author learned over time is that there are ways to prevent these outages, and he identified eight stability patterns.
“A degraded user experience is better than a complete system failure”
A theme from the book is that a degraded user experience is better than a complete system failure. What we did was assign this book to all of our engineering teams and make it a quarterly objective. We said each of the teams must read this book and by the end of the quarter, they needed to be able to apply these different stability patterns to our product.
These stability patterns have names like timeouts, circuit breakers, etc. The slide below outlines all eight.
At the end of that quarter, we had each of our teams generate an architecture diagram where they took their product and mapped out all their external dependencies. We wanted to be able to identify and label patterns, so for example with MPKI 8, they should’ve failed fast or timed out those queries to prevent that thread pool from being consumed.
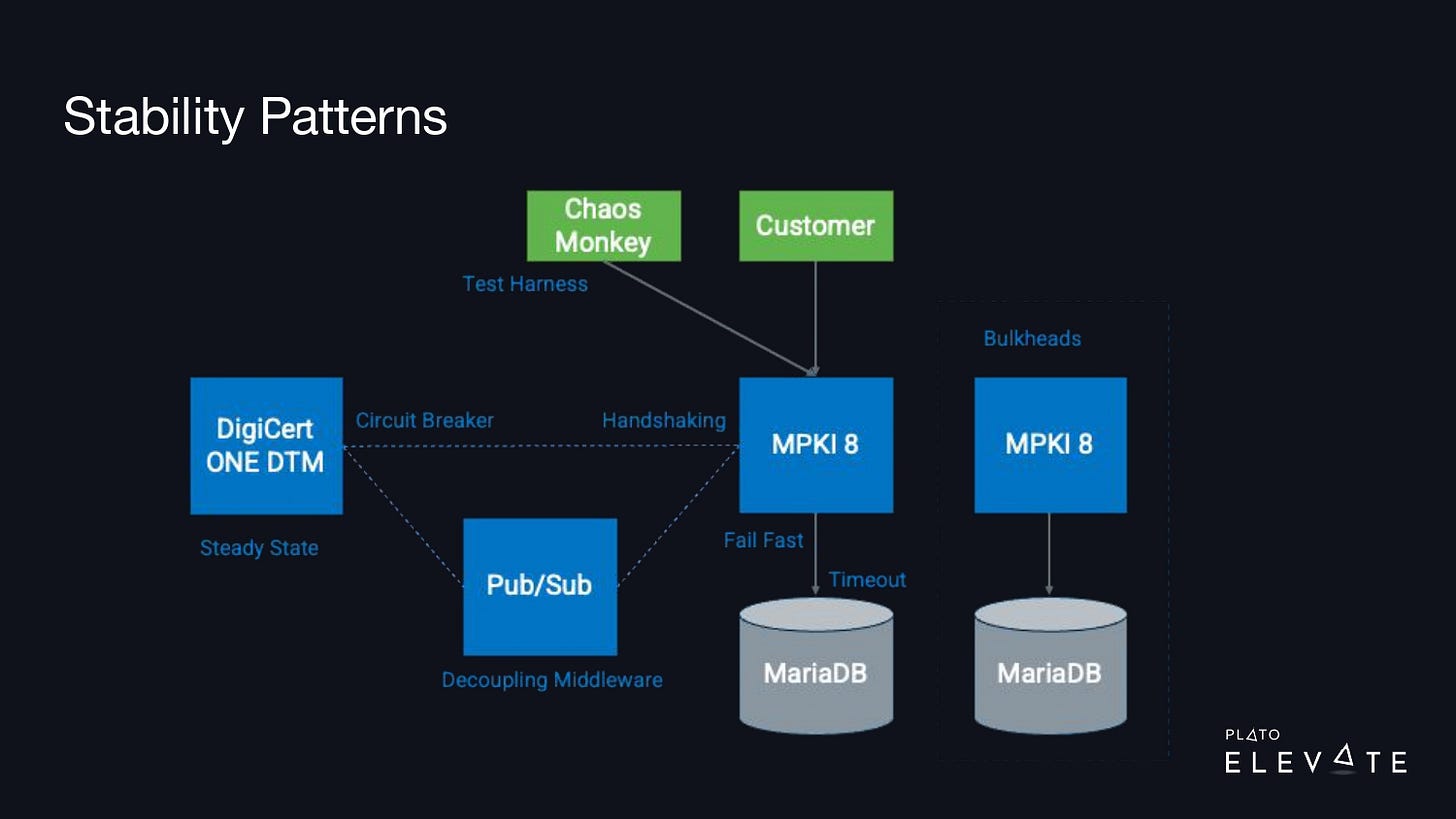
We noticed that it was common for one of our services to cause outages in other dependent services. We needed our engineers to have a defensive programming mindset and start thinking about all the potential issues their service might face in a production environment. What if a network connection was slow or went down? What would happen with your service if you got a large spike in requests? What if a downstream service was running slow or was down? The Release It! book helped give our team the right mindset.
Once our engineering team read the book, it took about two quarters to start seeing improvements. We made quarterly objectives for each team to create an architecture diagram to identify risky integrations and to implement the correct stability patterns in the high-risk integration to reduce and/or prevent outages in their product.
With the architecture diagrams and the data we generated from our outage reports, we were able to focus on some key patterns. One of those was “circuit breaker.” A circuit breaker is just like the one you have at home—if it trips, electricity no longer runs through that circuit.
When you use this in your product if your downstream application is down, the breaker will trip, and it will prevent that application from calling that. To speed up the adoption of these, we used open-source libraries like Resilience4J. We were able to create a dashboard that showed the state of these circuit breakers. When one was down, we could easily pinpoint where the outage was and this helped us considerably reduce our time to detect and time to recover from an outage.
Step 4: Implementing a rollback strategy
“Not having a rollback strategy can result in big outages”
Several years ago, I was on a team that had to migrate from one database to another. This was a big project and it would require some downtime, so we needed to do this during a maintenance window. To reduce the impact on our customers, we chose to do this at midnight on a Saturday.
We promised our customers that this rollout would not take more than a couple of hours. We got started, we were doing the rollout, and right away we started experiencing some issues. We were troubleshooting and we knew this was going to take longer than a couple of hours. As a team, we agreed that we needed to roll back, so the team went off to work.
About ten minutes later, I asked the team how it was going. Were the systems coming back online? And they said, “The rollback is not working, and it’s not going to work.” Our only choice was to roll forward. What should have been a 2-hour outage became a 24-hour firefight.
The CEO heard about this and when I went to talk to him about it, he told me I was “cliffed out.” He described the situation when a rock climber rappels down a mountain and reaches the end of their rope and they’re unable to go down or back up—they’re cliffed out and just stuck.
This was one of the worst outages I’ve experienced in my career, but it taught me a valuable lesson: Not having a rollback strategy can result in big outages.
In our HA project, bad deployments were another major factor causing outages. We would deploy a release and it could take several minutes (or longer) to roll back to a previously known good version/state.

At this time, our system design looked like the diagram above. We had a Kubernetes cluster, it was connected to a load balancer and a database cluster. The way we did rollouts was a rolling Kubernetes deployment and the changes could be introduced into production without any customer downtime, but what we didn’t have was any way to verify these changes worked, that there were no production configuration issues or production runtime issues before we put customers live into the systems. The system design didn’t have a quick way to roll back to a known good state and we needed a more comprehensive rollback strategy to prevent us from getting “cliffed out.”
In our production environment, we decided to do a standard blue/green deployment. We already had a Kubernetes cluster that we named green, and we added a second Kubernetes cluster we called blue. We then made it very easy to switch between clusters, so when we wanted to do a deployment, we could just switch clusters at the load balancer level. Additionally, we needed to support running multiple versions of our product at one time, so we needed to make sure any database changes we made were backward compatible, along with our web services. Any API changes needed to be backward compatible, too.
Once we got this in place, we were able to accomplish two different things: Now when we did a deployment, we could run a suite of automation tests against the changes to verify that there were no production configuration or production runtime issues. This meant we were able to prevent a lot of outages before they occurred because we could fix issues before they were live in front of our customers.
Also, second to that, if we happened to switch our customers over to that new cluster that had issues, within seconds, we could switch back to the known good state, so this had a big impact on reducing our mean time to recovery.
The results
In total, the changes we have made significantly reduced downtime across all products. While not all of our products have 99.99% uptime, some of them now do. We are still in the middle of transforming our culture, architecture, and technology to achieve 99.99% uptime in all products.
Lessons learned and final thoughts to share
“Production is a unique environment and it is impossible to replicate in a test/staging environment. The only way you know if your code is going to work in production… is to run it in production”
To recap, I’ve shared a few major learnings with you:
One giant leap: Don’t assume a big project is the only solution. Use data. Small, incremental changes can have a big impact on uptime.
You can’t improve what you don’t measure: It’s important to create a consistent way to collect data so you can begin to establish a baseline and start to identify problem areas.
The domino effect: You can prevent cascading failures with stability patterns.
Cliffed out: Don’t deploy code without a rollback strategy.
Our products and services are constantly evolving with new features and enhancements. It takes a lot of diligence to consistently hit 99.99%. We always have to manage change in our production environment.
The key mindset is that production is a unique environment and it is impossible to replicate in a test/staging environment. The only way you know if your code is going to work in production is to run it in production.
The biggest risk to production uptime is change. We need to continue to build our deployment and updating processes to manage change in our production environment. In future iterations of our HA plan, we will start to look at isolating change in our production environment so that we can limit the blast radius of a change that might cause an outage. We have been studying Availability Zones with a Cellular Architecture. If you’re curious to learn more about this topic, check out this article about how Slack is using a Cellular Architecture to increase its uptime.


